Recent Updates

Row

Welcome to the Michigan COVID-19 Modeling Dashboard

A resource for COVID-19 modeling built and maintained by the University of Michigan EpiMath team.

Row

Modeling Report Updates

Row

UM Modeling

Summary Document added for 09/23/20 - Community population changed from Washtenaw to Ann Arbor

  • Expansion of model of disease progression in asymptomatic individuals and testing in asymptomatic individuals

  • Update and expansion of sampling across wide distribution of parameter values

  • Added weekly surveillance testing of on-campus individuals

Forecasting

Row

About Forecasts

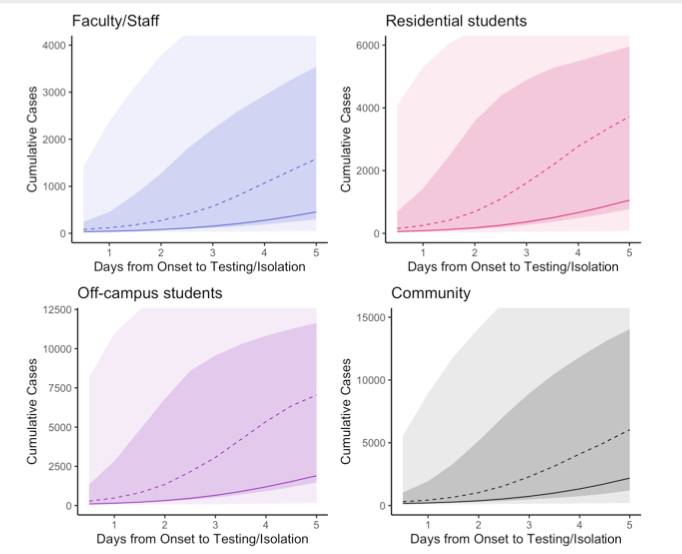
Data is shown as circles and grey shaded regions indicate uncertainty bounds for the best fit 95% across 1000 simulations. Hover over plots to see data values and interactive menu, and scroll down to see additional plots.

Row

Summary

Model forecast for cumulative lab-confirmed cases:

Date Uncertainty lower bound Best-fit Uncertainty upper bound
April 30 (1 week) 34166 37723 57682
May 14 (3 weeks) 34382 39933 108889

Additionally, the current best fit across model simulations projects (for uncertainty ranges, please see plots):

  • April 30, 2020 (1 week): roughly 2500 COVID+ hospitalized patients (beds needed) with roughly 340 in ICU
  • May 14, 2020 (3 weeks): roughly 1300 COVID+ hospitalized patients (beds needed) with roughly 180 in ICU

Note that the model is a work in progress and being updated as the epidemic progresses. Because we are still making improvements and including new data in the model, these results are highly preliminary and uncertain. The forecasts shown here also do not account for the ongoing changes in social distancing occurring over the coming weeks.

Row

1-Week forecast of Cumulative COVID-19 Cases in Michigan

3-Week forecast of Cumulative COVID-19 Cases in Michigan

Row

3-week forecast of Cumulative COVID-19 Deaths in Michigan

Row

3-week forecast of COVID-19 Hospitalized Patients in Michigan

3-week forecast of COVID-19 ICU Occupancy in Michigan

Row

3-week forecast of COVID-19 Oxygen Support in Michigan

3-week forecast of COVID-19 Ventilator Support in Michigan

Ensemble Modeling

Row

About Ensemble Modeling

We are working on collecting models and reports built by multiple groups across the UM campus and greater Michigan community.

This page will be updated as we do so!

UM Models

Row

UM Models

Row

UM Report for September 23, 2020

image of rapid testing model results Blurb explaining this report.

Row

UM Modeling Update for August 27, 2020

image of contact patterns in model Blurb explaining this report.

State and Regional Models

Row

Content to be added soon.

Reports & Analyses

Row

Reports and Analyses go here

Infographics

Row

Infographics go here

Explore Social Distancing Scenarios

Row

Social Distancing Scenario

Row

Summary

  • Early in the growth phase, social distancing efforts tend to delay the epidemic peak further, while efforts later in the growth phase nearer the peak tend to reduce the epidemic peak more.

  • Start efforts before the peak of the epidemic: social distancing is generally more effective when it is started during the growth phase of the epidemic—once the peak has already occurred the impact of social distancing is often much less.

  • Continue efforts until after the peak of the epidemic: to avoid a rebound in cases after social distancing efforts stop, social distancing efforts tend to work best if they continue past the peak of the epidemic. This means it will be important to consider how to make social distancing efforts sustainable.

Limitations

  • While in the growth phase of the epidemic, projecting the height and timing of the peak or overall duration of the epidemic is highly uncertain. Thus, these simulations should be used to explore potential scenarios and general patterns regarding the impact of social distancing, rather than for prediction of specific numbers.

  • This model represents just one simulation from the range of realistic parameter values used for forecasting (given in the ‘About’ tab).

  • This model does not account for stochasticity, i.e. the effects of randomness in contact patterns and the disease transmission process. This means that the model will not be able to capture the potential for random extinction of the epidemic during long periods with very few cases.

Vaccines

Row

Vaccines

This is a placeholder page

Publications

Row

Publications

This is a placeholder page

Featuring publications by the EpiMath team.

About this Site

Column

About the Site

This site is updated and maintained by the EpiMath team.

About the Models

Row

State, Regional, and County Level Models

Model Variants

Blurb about model variants.

Uncast Mobility

Blurb about uncast mobility.

Row

University of Michigan Models

Compartmental Models

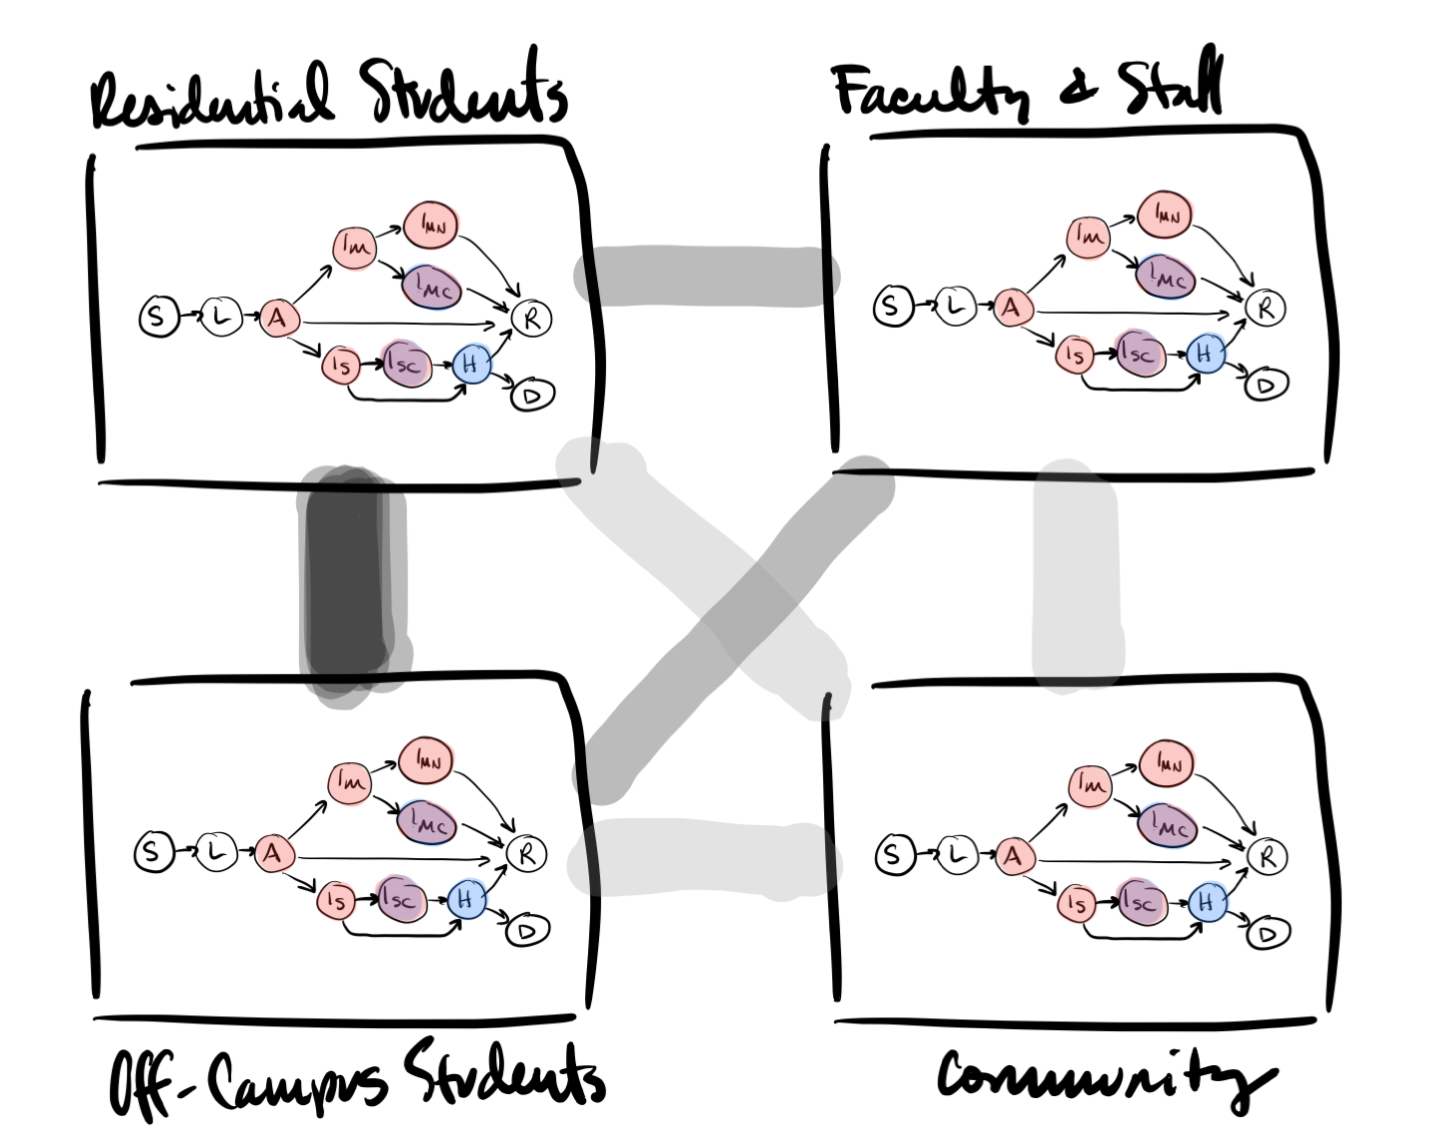
Blurb about compartmental models

Individual-based Network Models

Blurb about individual-based network models

Code

Row

About the Code

The below code was used to generate the different models used by the Michigan COVID-19 Modeling Dashboard.

Row

Code block 1

Description
hello <- "hello world"

Row

Code block 2

Description
hello <- "hello world"

Team

Column

The Team

The University of Michigan Epimath COVID-19 Modeling group is comprised of:

  • Andrew Brouwer, PhD - Department of Epidemiology, University of Michigan
  • Sandro Cinti, MD - Department of Internal Medicine, University of Michigan Medical School
  • Jeremy D’Silva, Department of Mathematics, University of Michigan
  • Peter DeJonge, Department of Epidemiology, University of Michigan
  • Marisa Eisenberg, PhD - Departments of Epidemiology and Complex Systems, University of Michigan
  • Emily Martin, PhD, MPH - Department of Epidemiology, University of Michigan
  • Josh Petrie, PhD, MPH - Department of Epidemiology, University of Michigan
  • Marissa Renardy, PhD - Department of Microbiology and Immunology, University of Michigan

Questions? Please contact Marisa Eisenberg (), Andrew Brouwer (), and Josh Petrie () for more information.